
The Problem with School Rankings
State-mandated report cards do not give justice to Shaker Schools, according to administrators
May 2, 2019
A community is known by the schools it keeps.
But is Shaker average? According to the Ohio Department of Education, yes.
However, the district boasts 11 National Merit Semifinalists from the Class of 2019, and 258 colleges worldwide accepted members of the Class of 2018.
So how can both of these things be true?
Because standardized state report cards have become the prevailing measurement of a school’s performance. The ODE states that its report cards “measure district and school performance in the areas most critical to success in learning.”
Although the district is widely acclaimed, Shaker fares poorly when compared to some other public schools by the ODE. The report card measures six categories: achievement, gap closing, kindergarten through grade three literacy, graduation, progress and preparation for success.
Shaker schools’ component grade for 2017-2018, calculated by finding the weighted average of all six categories, rates a perfectly average C.
“I’d say there is some significant bias to it,” said Chris Rateno, director of student data systems and accountability. The report cards “are not perfect by any means.”
According to Stanford University professor Sean Reardon, who studies poverty and inequality in education, these report cards favor districts that can dedicate more money to their schools.
The letter grade a school receives in each category is based on a range of measures: college acceptance rates, honors diplomas, industry-recognized credentials, Advanced Placement test scores, International Baccalaureate test scores, college credit and test scores.
Since the 2012-13 school year, Ohio has used three different standardized test companies for its mandatory K-12 testing. First, the Ohio Achievement Assessments were its system of evaluation. In 2014, the state began administering Partnership for Assessment of Readiness for College and Career assessments. Ohio’s membership in the PARCC consortium was short-lived; a new assessment was developed for evaluation and issued by the American Institute of Research. The AIR test was first administered during the 2015-16 school year.
Though the specific testing method has shifted, the state report cards are dependent upon the same measures.
Shaker schools’ component grade for 2017-2018, calculated by finding the weighted average of all six categories, rates a perfectly average C.
Dr. John Morris, president of the Shaker Heights Teachers’ Association, offered reasons for Shaker’s uneven performance on the ODE tests. “I think we have two things going on: a district that does not teach to the test, and a social economically heterogeneous population. That means some kids come to school with a lot of background knowledge, and some kids come to school with not as many advantages, and that’s where we get this divergence in how kids do on test scores,” he said.
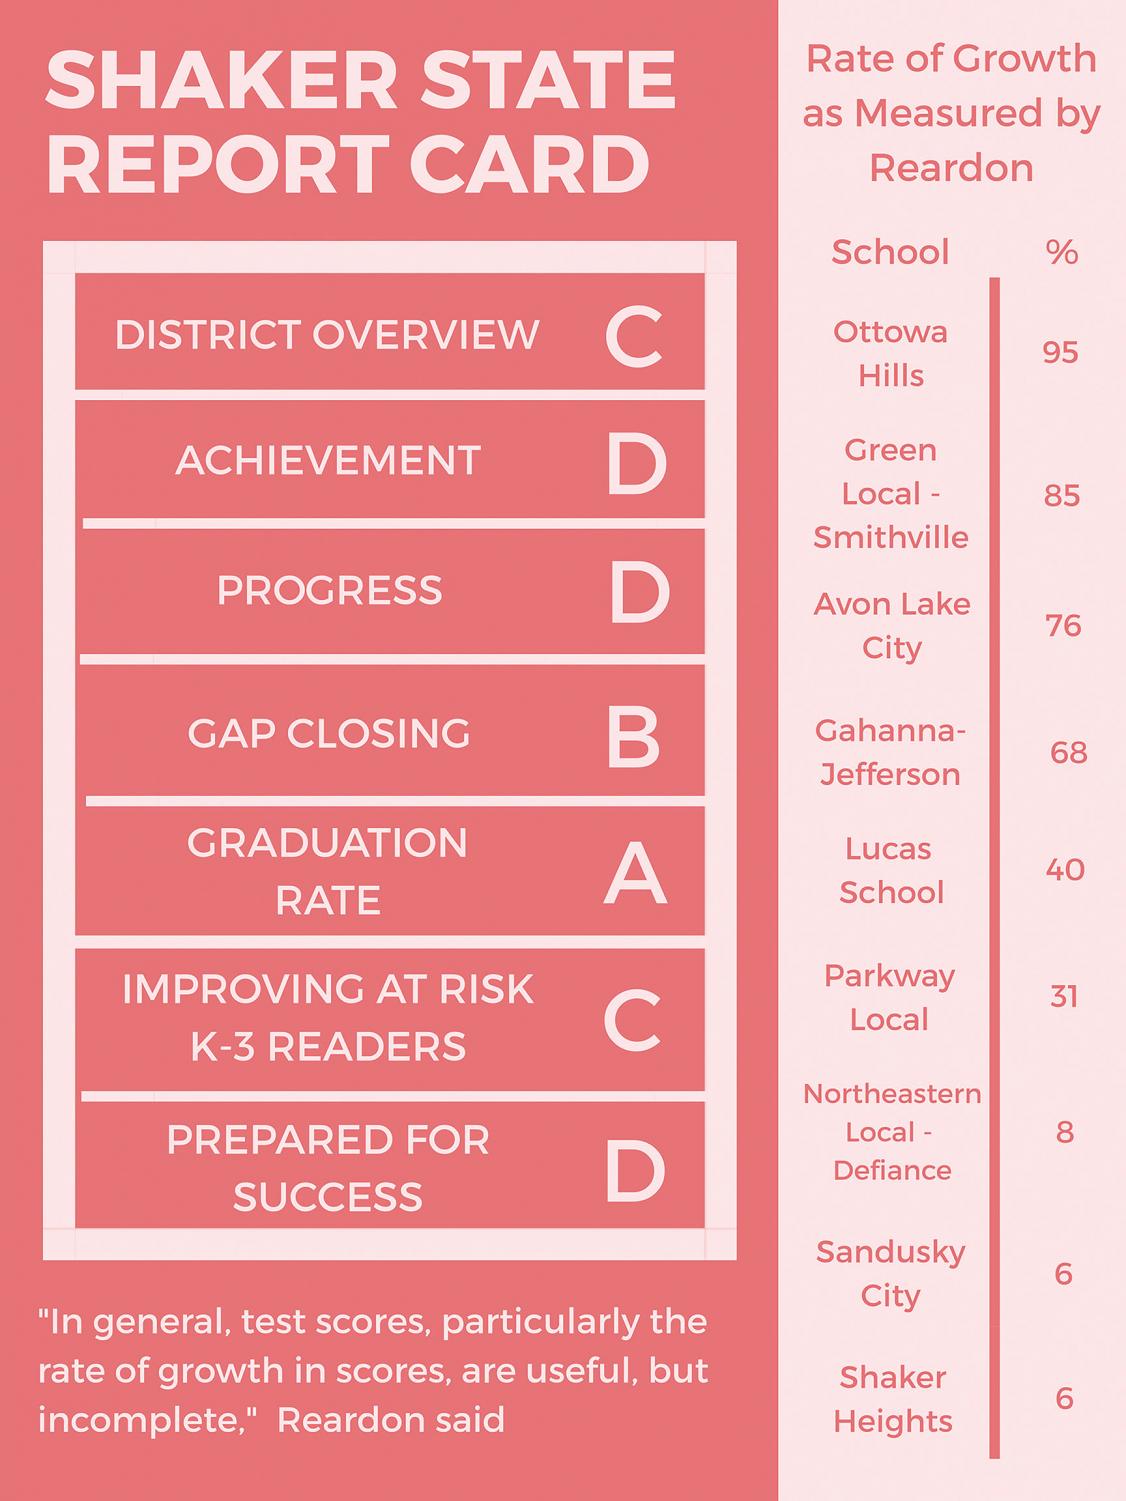
Reardon said that test scores don’t represent some important measures. “Test scores, particularly the rate of growth in scores, are useful but incomplete measures of school [or] district quality. They don’t measure other aspects of school quality, such as how well they help children develop creativity, cooperation skills, empathy, moral character and so on,” Reardon stated in an email interview.
Although the state report cards are the typical way to rank schools, alternate ways of measuring the strength of school districts have been published.
In late 2017, the New York Times published “How Effective is Your School District?” In the article, reporters reference a study completed by Reardon that ranks schools based on how much students learn from third to eighth grade.
The study also shows that socioeconomic status and school finances do necessarily govern how much students grow academically. Instead, the study indicates that some schools with less money have students who exhibit higher rates of “growth.”
“It’s important to separate wealth from school quality. Our data shows there are lots of places with good schools, as measured by test score growth, that are not wealthy,” Reardon said.
Shaker finds itself in the lowest 6 percent of all schools measured in Reardon’s test. Students’ standardized test scores only grow 3.8 grade levels between third and eighth grade, according to his analysis.
Morris said that Shaker’s high mobility rate affects student growth. “Because we’re right on the edge of a major city, we might have a populous of people who might not be here for a long time. It just gives us an even more heterogeneous population based on mobility,” Morris said.
Freshman Maclin Stupay offered another explanation. “We take too many standardized tests, and kids might not take them seriously because there are so many. I think we can improve these grades by specifying what tests these are, because they are a little bit much,” he said.
Grandview Heights Schools in Columbus scored within the 96th percentile of all schools by Reardon’s measures. Grandview Heights Superintendent Andy Culp said a combination of factors explains how well Grandview Heights scored, such as high-achieving students, supportive parents, personalized learning experiences and a low student-teacher ratio — the Grandview Heights student-teacher ratio is 12:1. Shaker’s is 16:1.
However, Grandview Heights is an outlier among schools that typically do well by Reardon’s measures, as most high-scoring schools have a low median household income and a high minority student population.
Grandview Heights is funded at an above state average per pupil expenditure. Nevertheless, Culp said his school routinely scores well on school rankings because their retention rate is very high. “Students that start here stay here, which is helpful in terms of impact on learning and growth,” he said.
When Rateno sees low district grades based on state-mandated report cards, he reads them differently. “When you look at it, we did not do as bad as it looks, and we’re growing. There’s a lot of growth,” he said.
In 2016, Shaker received Fs in eight categories. In 2017, Shaker received one F and two Ds. This year, there were no Fs. In all, Shaker improved in 17 of 21 indicators on the state report card. These indicators include scores on end of course exams from third to eighth grade and other end of course exams in high school.
Rateno said that other types of scoring, based on holistic approaches, might be able to accurately evaluate Shaker. “Talk to students, get feedback from students, looking at success studies over time would be a definite way to do it. Look at the opportunities that exist as opposed to other schools,” he said.
Although Shaker has not conducted a holistic study — which would be costly — the district does annually publish a report titled “Measuring What Matters,” which presents “data on many dimensions of quality that are important to the education of children.”
These include parental involvement, motivated students, community involvement, varying extracurricular activities, high-quality curriculum, good teachers, and an education that brings forth diverse learning styles.
“Really, that’s more of a qualitative analysis, and that’s a better way to do [ranking] than quantitative,” Rateno said.
“I think Shaker is honestly is one of the best [high schools] in the country. I think basically the things that make us not do well on tests are our strengths,” Morris said.
Stronger indicators of a district’s success include “looking at the number of kids who go to two-to-four-year colleges, kids who are scoring above 19 on the ACT, the number of kids involved in extracurriculars, the number of students in sports,” he said.
There is no perfect way to rank Shaker schools — or any schools.
Unless “multiple measures and multiple metrics, as opposed to one measure, on one day, at one specific time,” are used to rank schools such as Shaker, results will be skewed, Rateno said.
The Ohio Department of Education’s method of grading schools and school districts is complex. Here are so explanations of ODE measures:
Within the component, or overall, grade, achievement is weighted at 20 percent, progress at 20 percent, graduation rate at 15 percent, gap closing at 15 percent, improving at-risk K-3 readers at 15 percent, and preparation for success at 15 percent.
This year, Shaker received a D in achievement, a D in progress, a B in gap closing, an A in graduation rates, a C in improving K-3 at-risk readers and a D in preparing for success.
The performance index, part of the achievement component of the report card, measures the test results of all students. The grade is calculated out of 120 points, and Shaker received an 89.2 points last year.
Districts receive higher scores if students take higher-level courses and score well on their end-of-course exams. The 74.3 percent Shaker received is low on the scale. In comparison, Solon High School received a 91.25 percent, and Indian Hill High School near Cincinnati received a 86.25 percent.
The progress index measures the growth students make based on past test results. The district received an F overall, but because gifted students received a B, the component grade was boosted to a C.
The gap-closing component measures how well a district’s most vulnerable students are meeting performance expectations. The graduation component measures the percent of students who graduate within four years. In 2017, 94.2 percent of Shaker students graduated.
The K-3 literacy component measures how well schools improve at-risk, or struggling, K-3 students’ reading levels. Coming into third grade, 292 Shaker students started “off track,” in terms of their reading abilities. Once the year concluded, 143 students moved “on track,” according to the ODE.
Districts are required to create Reading Improvement and Monitoring Plans for students not on track to become proficient in English Language Arts by the end of the third grade.
Shaker received nine deductions from its K-3 reading score. The number of students who moved on track (143) was subtracted by the nine deductions (to make 134), then divided by the number of students who started “off track” (292). That percentage is 45.9, which qualifies as a C.
These deductions are taken when students do not score proficient or higher on the Ohio state third grade English Language arts test and do not “receive services through a reading improvement and monitoring plan,” according to the ODE.
Among Shaker third grade students last year, 99.4 percent met the state’s Third Grade Reading Guarantee requirements for promotion to third grade, and 77.2 percent of third graders scored proficient on the state English Language Arts Test.
Finally, preparation for success measures how well students are prepared for future opportunities. This score is calculated by adding the “number of students that earned a remediation free score on all parts of the ACT or SAT, earned an honors diploma, and/or earned an industry-recognized credential” to the “number of students that count for .3 points each, because they scored a 3 or higher on at least one AP exam; a 4 or higher on at least one IB exam; and/or earned at least three college credits before leaving high school,” divided by the graduation cohort, 875. Shaker scored a 57.1, which qualifies as a D.
In comparison, Hudson, with a median household income of $132,000, received four As, one B and one C from the ODE. Shaker’s median household income is $76,000.
A version of this article appears in print on pages 26-29 of Volume 89, Issue I, published Dec. 21, 2019.